How well do universal potentials
predict melting?
A compact, challenging benchmark for melting-temperature predictions.
Compare model accuracy, systematic bias, and reported computational cost.
MeltBench-10
Mean absolute melting-temperature error in kelvin. Lower is better.
Mean signed error, prediction − reference. Negative values indicate underprediction. See the reference caveat below.
Evaluated materials out of the ten-material suite. Missing points are not assigned zero error or automatically classified as failures.
Median reported GPU hours per run, before DFT corrections. On NVIDIA A100. Timing counts are separate from accuracy counts.
| # | Timing records available / total |
|---|
PFP/Matlantis timing: Values shown in the GPU-hours column are elapsed LAMMPS runtime, used as a proxy—not measured backend GPU usage. They are not directly comparable to dedicated-GPU hours for other models.
Accuracy meets speed.
Explore the reported error–cost trade-off. Lower and further left is better.
Reported GPU hours are on NVIDIA A100. Models without reported timing remain in the table but have no cost-chart marker. Shapes distinguish complete and partial coverage.
Ten materials. Different challenges.
Select a material to compare exact predictions, uncertainties, and source runs.
Benchmark at a glance
All ten materials in one view. Above zero means overprediction; below zero means underprediction.
Updates with the leaderboard and follows your model filters. Whiskers show ±1 statistical standard error; missing results are gaps, not zero. Error is prediction minus reference; the alloy reference is DFT-based.
Al
Error = prediction − reference. Whiskers show the prediction’s statistical standard error, not reference uncertainty or systematic model error. Missing results are not zero.
| Model | Prediction ± SE K | Signed error K | Source runs | Job details |
|---|
Repeated runs are combined by inverse statistical variance. Models and points follow the leaderboard’s current filter.
View the archived benchmark figure · 18 Oct 2026
Melting-temperature errors by material
Archived figure—not the live leaderboard · whiskers show standard errors
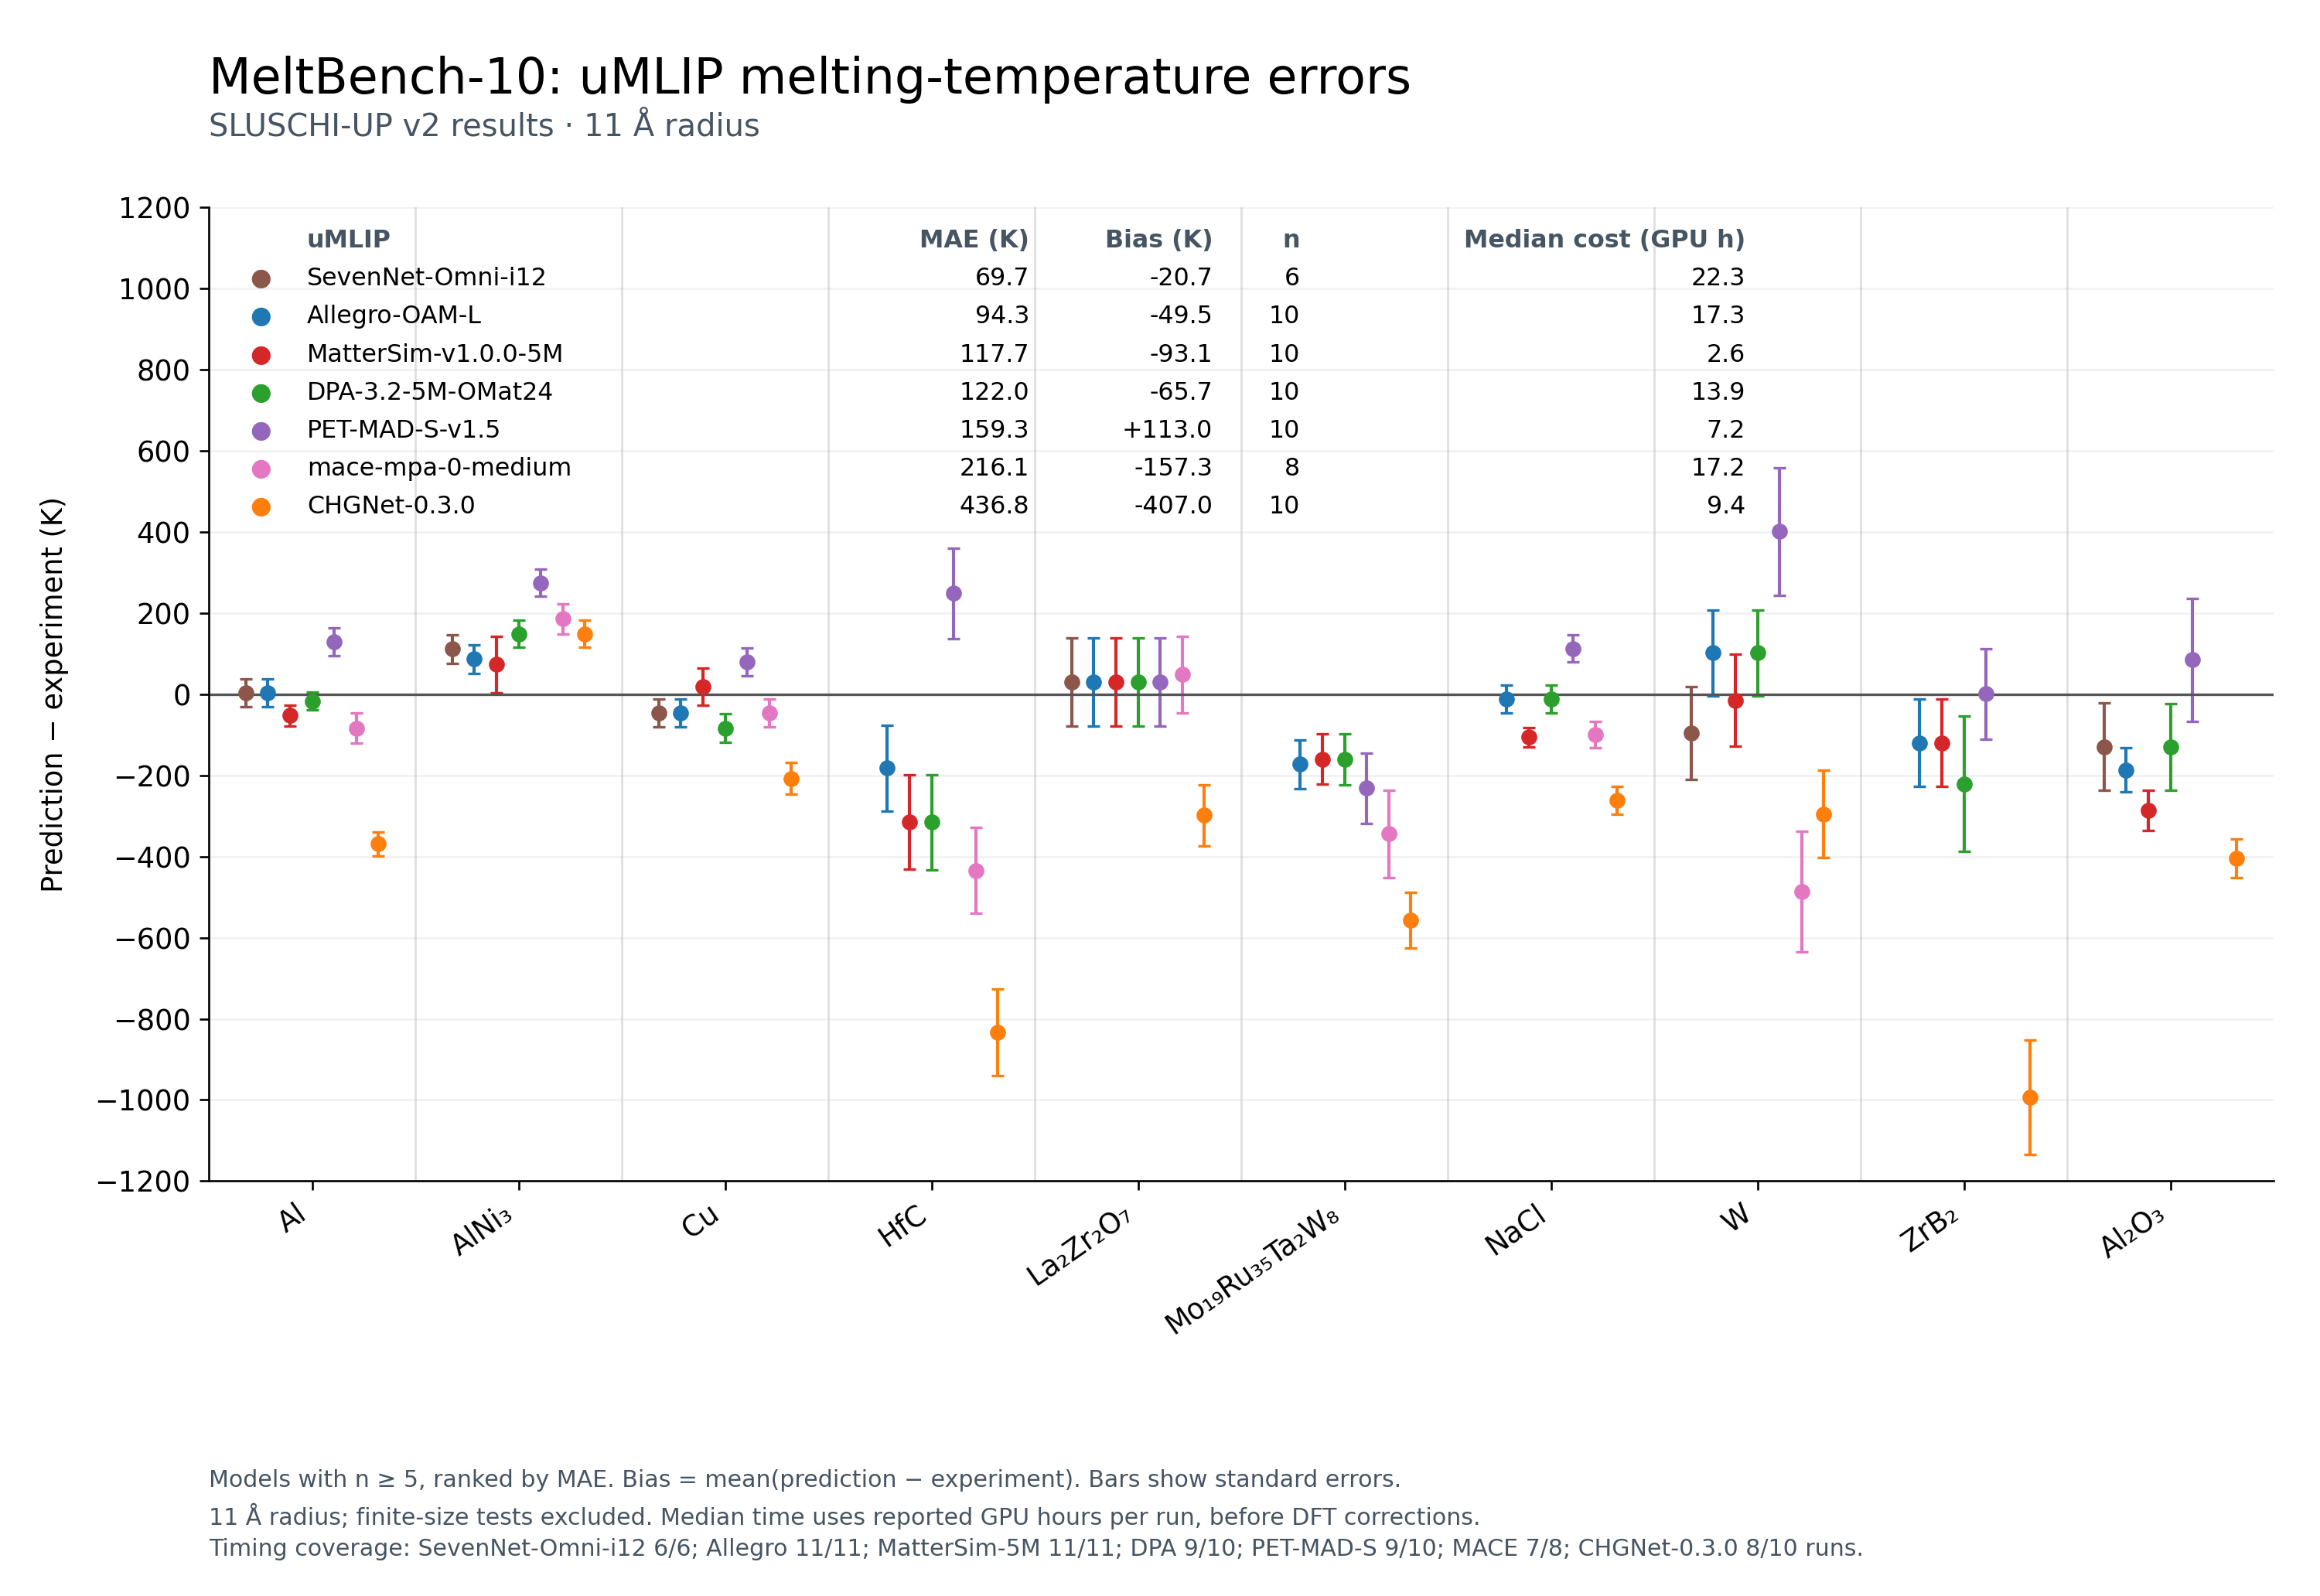
This author-supplied image is retained as an October 18, 2026 archive; its values do not update. The tables, interactive charts, and data exports above use current uploaded results. The original image’s “prediction − experiment” label includes the alloy-reference caveat described below.
How much does size matter?
MatterSim-v1.0.0-5M · SLUSCHI-UP v2 · Al, NaCl, and α-Al₂O₃
The benchmark uses an 11 Å radius. Explore how melting temperature and reported computational cost change as the simulation cell grows.
Loading the latest uploaded results…
Shift = T(radius) − T(20 Å). The 20 Å result is a finite-cell reference, not an infinite-size limit. Whiskers show ±1 statistical standard error; the reference point is zero by definition.
Exact values and source jobs
| Material | Radius (Å) | Temperature ± SE (K) | Median cost (GPU h/run) | Total cost (GPU h) | Timing records / fits | Atoms | Fits | Source jobs / status |
|---|
How to interpret this study
This study isolates size dependence within MatterSim-5M; it does not measure the accuracy of other uMLIPs. A small shift relative to 20 Å is evidence of agreement at the reported precision, not proof of convergence to the thermodynamic limit.
Eligible raw fits require finite T > 0, 0 < SE < 300 K, and no unreliable flag. A failed job with an eligible fit remains usable. Repeats with the same structure and radius are combined by inverse statistical variance. Unfinished runs remain listed and never become zero-valued data points.
Cost comes from the latest uploaded “Total GPU hours” MD summary. Median cost uses contributing usable runs with reported timing. Total cost is shown only when every contributing run has timing; neither value is inverse-variance weighted. Missing timing stays blank in CSV exports. Uploaded costs may omit earlier failed attempts or restarts and are not hardware-normalized.
Shift uncertainties combine the two independent standard errors in quadrature. Shifts share the same 20 Å reference and are correlated. Systematic errors, correlated trajectories, and possible differences between older and newer workflow revisions are not included. Explicit v2 metadata takes precedence; otherwise the established September 23, 2026 date estimate applies.
Updates are checked every 60 seconds while this page is visible. Results appear only after upload. A failed refresh retains the last successful view with its original timestamp and a warning. The finite-size data do not change the 11 Å leaderboard above.
A benchmark,
not a blanket endorsement.
Use the metrics together. A low error on a smaller subset and a low runtime on different hardware do not establish a universal winner.
Read the SLUSCHI-UP paperEvaluation protocol
SLUSCHI-UP v2, 11 Å baseline radius; unreported radii assume the 11 Å default. Explicit finite-size tests are excluded. Models enter the ranking once eligible results are available for at least five of the ten benchmark materials. These are raw predictions before PBE or R2SCAN corrections, regardless of correction availability.
Sample counts and missing data
Accuracy coverage counts materials, not MD trajectories. Eligible fits require a positive finite temperature, 0 < SE < 300 K, and no raw-fit unreliable flag; a failed website status alone does not exclude a usable fit. The timing denominator counts contributing runs and can differ from accuracy coverage. Missing points are not zero error or confirmed model failures.
Experimental and other references
Benchmark references remain fixed to the October 18 collection’s experimental_k values, matched by reduced composition—not its alternative reconciled reference. The Mo₁₉Ru₃₅Ta₂W₈ reference (2542 K) is DFT-based. Interactive charts therefore say “reference” rather than implying every value is experimental. Original literature citations should be audited before a formal benchmark release.
Repeated runs and uncertainty
For each material and exact model, repeated eligible runs use T̄ = Σ(Tᵢ/SEᵢ²) / Σ(1/SEᵢ²), with combined SE = √[1/Σ(1/SEᵢ²)]. This assumes independent statistical errors; shared systematic errors or correlated trajectories are not represented. Whiskers do not include reference uncertainty. Grouping by composition does not establish identical structures or simulation conditions.
Computational-cost interpretation
Cost is the median of reported GPU hours per contributing run before DFT corrections; no GPU cost is guessed from wall time. Timing availability is listed independently. Tests were performed on NVIDIA A100 GPU.
Live updates and reproducibility
The page checks uploaded results on page load, once per hour while visible, and when you return to this tab. “Last checked” indicates when the server generated the displayed snapshot, not when a calculation last changed. The server reads current uploaded public job results and caches calculations for at most 30 seconds; results cannot appear before the reporter uploads them. Filters and selections stay in place. All data exports use the last successful live response, including its timestamp, source job IDs, and rules. A failed refresh is labelled explicitly; bundled snapshot data are never silently substituted. Explicit v2 metadata takes precedence, otherwise the existing September 23, 2026 Phoenix-date estimate is used.
Looking beyond MeltBench-10?
Explore ongoing calculations or download the broader archive. Archive records are not mixed into this leaderboard.